
Before signing a compromise or launching a solar panel project, reliable data is needed: knowing how long the sun actually hits each facade. A visit at noon on a sunny day is not enough. Google Earth, with its satellite views and measurement tools, allows you to cross-reference orientation, relief, and shadows without leaving your desk.
Shadows and Relief: What Google Earth Shows Before a Field Visit
The first instinct when looking for sunlight exposure of a property is to check the orientation. South, southwest, due north. Google Maps already allows this since north is always at the top of the screen. Google Earth goes further.
By activating 3D mode and tilting the view, you can visualize the relief around the property: a hill to the east, a taller neighboring building, a row of mature trees to the south. These elements create solar masks that reduce actual sunlight exposure well below what the theoretical orientation would suggest.
Specifically, you locate the parcel in satellite view, then switch to 3D. You rotate the camera to observe obstacles from different angles. Google Earth’s ruler tool allows you to measure the distance between a neighboring building and the studied facade, giving a first idea of the angular height of the obstacle.
You can also consult a sunlight map with Google Earth to complement this visual analysis with local climate data and better understand the impact of climate on the targeted property.
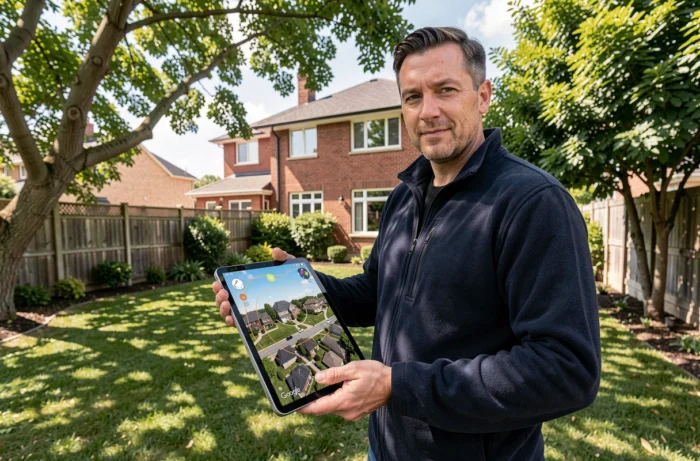
Simulating the Sun’s Path on Google Earth: Step-by-Step Method
Google Earth Pro (the free version for computers) includes a feature often overlooked: the solar simulation slider. You access it via the View menu, then Sun. A time slider appears at the top of the screen.
Setting the Date and Time to Observe Shadows
First, choose a representative date. To evaluate the worst-case scenario, select the winter solstice (late December in the northern hemisphere). For the best case, the summer solstice. Then slide the hour slider hour by hour and observe how the shadows move across the parcel.
- Winter solstice, 9 AM: check if the south facade is already receiving sunlight or if an obstacle masks it until late morning
- Winter solstice, 3 PM: observe at what time the shadow of a neighboring building or hill covers the garden
- Summer solstice, 7 AM and 8 PM: measure the actual length of the sunny day on the property
- Equinoxes (March, September): obtain an intermediate situation, closer to the annual average
This simulation remains approximate because Google Earth models buildings in 3D from photogrammetric data, the accuracy of which varies by area. In dense city centers, the models are often accurate. In rural or suburban areas, some trees or sheds may be missing from the 3D model, which skews the result.
Saving Screenshots to Compare Multiple Properties
You can take a screenshot at each key hour and assemble them in a document. By comparing two properties, you can quickly identify which retains direct sunlight longer in winter, impacting thermal comfort and heating bills.
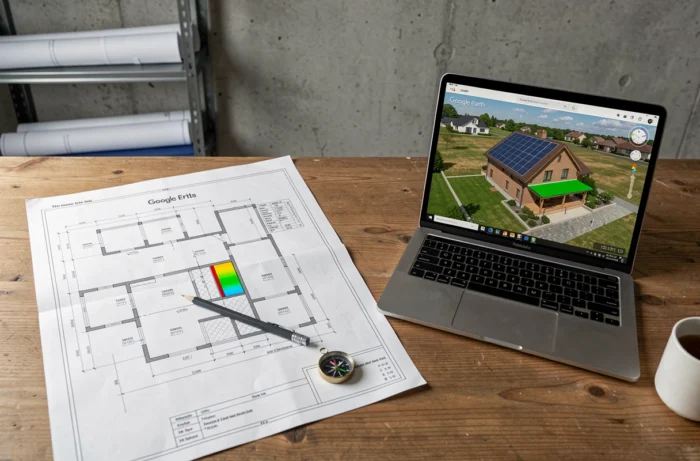
Google Earth and Solar Panels: Estimating the Potential of a Roof
For a photovoltaic project, the orientation and tilt of the roof matter as much as the absence of shadows. Google Earth allows you to measure both.
Using the surface measurement tool, you trace the outline of the targeted roof slope to estimate the available area. In 3D mode, you visually assess the tilt (a flat roof, a gentle slope, a steep slope). This is not a precise degree measurement, but it is enough to rule out a poorly oriented roof before paying for a diagnosis.
You then combine this information with the solar simulation described above. If the southwest slope loses sunlight at 2 PM in December due to a neighboring building, winter production will be significantly reduced. It’s better to know this before requesting a quote from an installer.
The Google Solar API, available via Google Maps Platform, takes this logic further by automatically calculating the solar potential of a roof based on irradiance data. Access is technical (intended for developers), but several public online simulators use it, including regional solar cadastres.
Limitations of Google Earth for Sunlight Analysis
Google Earth provides a solid first filter, not a definitive diagnosis. A few points to keep in mind:
- Satellite images can be several years old: a felled tree or a recently constructed building may not appear
- 3D modeling lacks precision in low-density areas, making shadows less reliable
- The software does not account for local cloudiness or microclimates (frequent fog in the valley bottom, for example)
A field check is still necessary for any project involving a budget, whether it’s solar panels or a real estate purchase. You can complement the analysis with a traditional compass and, for photovoltaic projects, a shadow survey conducted by a professional with dedicated equipment.
Google Earth works best as a pre-selection tool. You can quickly eliminate properties where the built environment or relief compromises sunlight exposure, and focus field visits on properties that pass this first filter. In a market where listings rarely mention solar masks, this is a concrete advantage even before getting in the car.